
Pappu Playing Pictures RTP and Odds: Chances for Every Pick
Updated:
Each picture in Pappu Playing Pictures has a 1-in-12 (8.33%) chance of being drawn. A 1-in-12 event breaks even at 12x the stake returned, and the base payout is 10x, so the base game alone returns less than the stake; Extra Pay lifts the average. Jili publishes no RTP percentage for it.
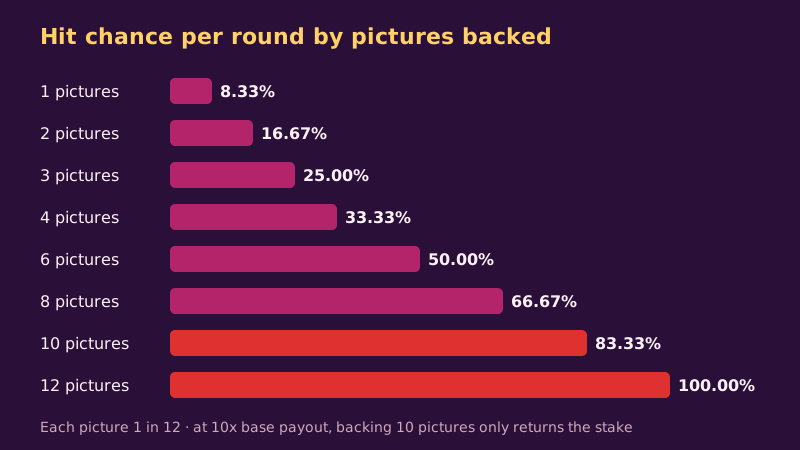
Pappu Playing Pictures odds per picture
With 12 pictures and one picture drawn per round, a single pick wins with probability 1/12 = 8.33%. It loses with probability 11/12 = 91.67%. Backing k pictures raises the chance to k/12.
| Pictures backed | Hit chance | Miss chance |
|---|---|---|
| 1 | 8.33% | 91.67% |
| 2 | 16.67% | 83.33% |
| 3 | 25.00% | 75.00% |
| 4 | 33.33% | 66.67% |
| 6 | 50.00% | 50.00% |
| 8 | 66.67% | 33.33% |
The table assumes every picture has equal draw probability, which is the standard for a picture-draw game. The provider does not publish a draw table in the demo.
Pappu Playing Pictures RTP: what the numbers show
RTP is the share of stakes the game returns over millions of rounds. Neither Jili's game page nor the reference listing publishes an RTP figure for this game, so this site gives no percentage and shows the arithmetic instead.
| Payout reading | Base payout | Return per 1 staked at 1/12 | Implied RTP |
|---|---|---|---|
| 10x is the total returned (stake included) | 10x | 10 / 12 = 0.8333 | 83.33% |
| 10x is profit on top of the stake | 11x total | 11 / 12 = 0.9167 | 91.67% |
The break-even multiplier for a 1-in-12 pick is 12x total return. The base payout sits below it under both readings, and the gap is what Extra Pay and the Crit boost fill in. How often the boost lands is not published in the demo, so the full RTP cannot be derived here. Check the info screen of the game at your casino for the provider's figure.
Pappu Playing Pictures expected loss calculator
Enter your stake per picture, the pictures you back and the multiplier. The calculator uses 1/12 per picture and shows hit chance, the implied RTP and the expected loss over your rounds.
Coverage maths: why backing many pictures loses
Backing k pictures with equal chips of 1 costs k per round and returns 10 when one picture hits (10x total reading). The net on a hit is 10 - k. At k = 10 the hit returns your stake. At k = 11 or 12 the hit pays less than the stake, so every round loses. The expected return per round is the same 10 / 12 per chip at any k; coverage changes the swing, not the average.
Expected loss over many rounds
At the 10x total reading the implied RTP is 83.33%, so each 100 staked loses 16.67 on average before Extra Pay. Over 100 rounds at a stake of 10 per round (1,000 staked) the expected loss is 166.7 at the base payout. Extra Pay reduces this loss; the calculator lets you test a higher average multiplier.
Use the strategy rules to size stakes, the payout table for the multipliers, and the review for the overall verdict.
Pappu Playing Pictures streak maths
The chance of no hit for a picture over n rounds is (11/12)^n.
| Rounds | Chance of no hit | Chance of at least one hit |
|---|---|---|
| 5 | 64.7% | 35.3% |
| 12 | 35.2% | 64.8% |
| 24 | 12.4% | 87.6% |
| 36 | 4.4% | 95.6% |
| 50 | 1.3% | 98.7% |
A picture appears on average once every 12 rounds, and long gaps are normal. The same maths applies to every picture.
Pappu Playing Pictures Extra Pay in the odds
The boost multiplies a payout that already needs a 1-in-12 hit. If a boosted picture pays 50x, the break-even is far exceeded for that round: 50 / 12 = 4.17 times the fair price. How often it lands sets the long-run return, and the demo does not publish that frequency. When your casino shows an RTP for the game, enter it as a check: expected loss per 100 staked = 100 - RTP.
How to read the Pappu Playing Pictures odds table
Use the first table for the chance of one round, the streak table for several rounds and the calculator for money. A hit chance of 8.33% does not mean a hit every 12 rounds; it means one hit per 12 rounds on average over a long run. For a picture backed in 100 rounds expect about 8.3 hits, with a normal spread of roughly 2.7 hits either way (one standard deviation, sqrt(100 x 1/12 x 11/12)). Compare your own session with that spread before you read a pattern into it.
Pappu Playing Pictures house edge in numbers
House edge is 100% minus RTP. At the 83.33% implied return of the 10x total reading, the base game keeps 16.67 of every 100 staked; at the 91.67% reading it keeps 8.33. A stake of 1,000 over a session therefore costs 167 or 83 on average before Extra Pay. Use the calculator above with a higher multiplier to see how much a frequent boost changes that loss.